For the Chief Financial Officer, user experience (UX) has historically been viewed as a soft, aesthetic cost center. When product and design teams request capital to fund interface redesigns or new front-end development, they often present their proposals using subjective, non-financial terminology. They argue that a new layout will make the application feel more modern, or that it will make the registration flow more engaging. To a CFO focused on margin protection, rising taxes, and capital allocation, these aesthetic arguments carry little weight. Design changes must not be evaluated on visual appeal. They must be measured by their direct impact on the balance sheet. In the online gaming industry, where player acquisition costs (CAC) are rising and retention is low, usability is a primary driver of financial performance. Under the Jurnii UX framework, we translate experience metrics directly into financial Key Performance Indicators (KPIs). We connect page load speed, input error rates, and security placement to first-time deposits (FTDs), hold rates, and Net Gaming Revenue (NGR). By grounding your user experience decisions in financial reality, you convert design from a speculative expense into a measurable revenue driver, ensuring that every engineering hour invested delivers a clear, quantifiable return.
The Financial Language of Experience
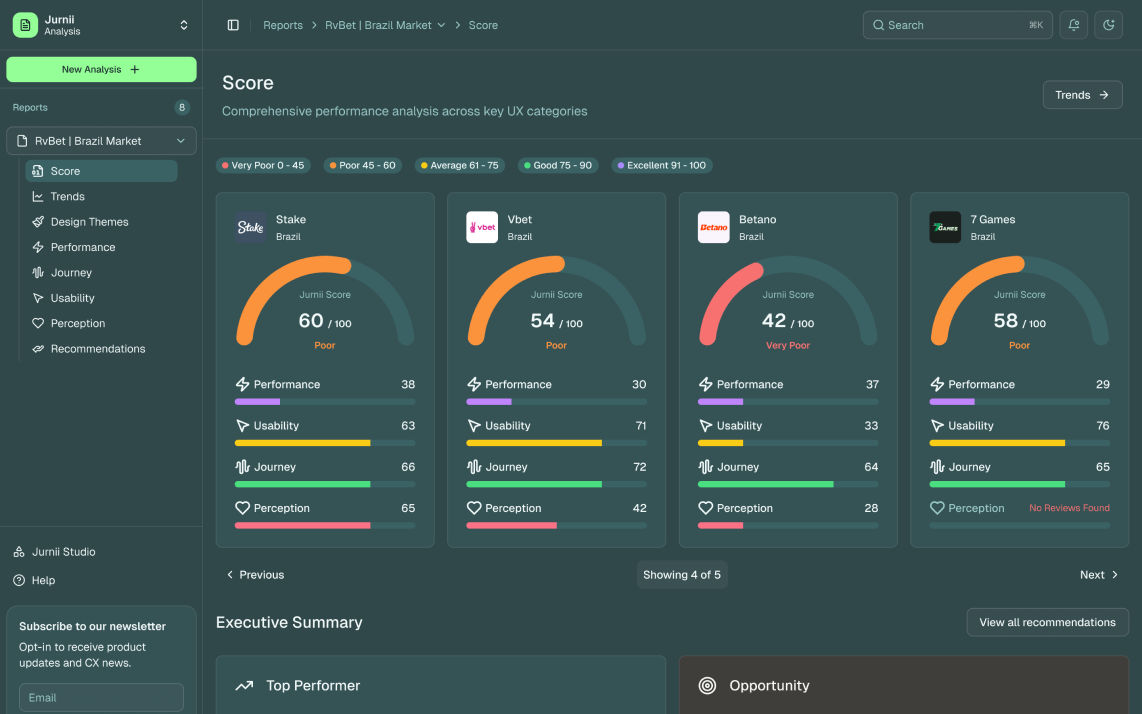
The primary obstacle to experience optimization is a communication gap. Product design teams and finance departments speak entirely different languages. Designers focus on components, typography, layout consistency, and user satisfaction scores. CFOs focus on NGR, return on asset (ROA), cash flow, and player lifetime value (LTV). This division creates an operational bottleneck. Product teams fail to secure budget for critical usability upgrades because they cannot prove the financial cost of friction. Jurnii UX bridges this gap by acting as a translation layer. We analyze your digital experience across 21 distinct feature areas, converting usability findings into a standardized financial index. Instead of reporting that "the deposit page is confusing," Jurnii UX quantifies the deposit completion ratio. We show that a validation error on the credit card input field is causing a 12% abandonment rate among high-value players. By placing a financial value on this friction point—calculating the exact NGR lost from abandoned deposits—we give the product team the commercial visibility needed to justify optimization spend. Experience optimization becomes a structured project with a clear, board-defensible return on investment (ROI).
Attributing Net Gaming Revenue to Usability Performance
To attribute NGR growth directly to usability improvements, you must apply a structured financial methodology. Jurnii UX isolates external market variables to measure the exact revenue recovered from removing design friction. Consider the registration funnel. If your marketing team drives 10,000 prospective players to your registration landing page monthly, but your registration completion rate is only 40%, you are leaking 6,000 potential accounts. If Jurnii UX audits reveal that 20% of this abandonment occurs at the postcode input field due to a slow, manual verification API, the cost of that validation friction is clear: 1,200 lost accounts monthly. If your average first-time depositor (FTD) delivers an initial value of £50, this single usability flaw is costing your business £60,000 in monthly FTD volume. By implementing Jurnii Studio's optimized address autocomplete component, you resolve this validation barrier. If the registration completion rate subsequently rises from 40% to 45%, you acquire an additional 500 depositors monthly. This shift generates £25,000 in incremental monthly revenue, directly attributable to the interface optimization. By applying this financial math to every step of the player journey, you can see exactly where friction is leaking revenue and how much NGR your optimization team recovers.
The Cost of Latency in the Transactional Funnel
Technical performance is another area where minor design choices have severe financial consequences. Many operators treat page load speed as a pure technical metric rather than a conversion driver. However, in transaction-heavy funnels like sports betting betslips or payment confirmation screens, speed is directly linked to transaction success. Jurnii’s database shows that any latency over our 1.2-second performance threshold correlates with immediate transaction abandonment. For every 0.1-second delay in page rendering or button responsiveness on a payment confirmation screen, deposit success rates drop by 1.8%. This latency drop directly compresses your net gaming revenue. If your payment confirmation screen takes 2.5 seconds to process—1.3 seconds over the threshold—you are suffering a 23.4% reduction in deposit completion rates. For an operator processing £1,000,000 in monthly deposits, this latency is leaking over £230,000 in potential player funds. Optimizing your front-end code, compressing assets, and streamlining payment scripts are not just maintenance tasks. They are direct revenue protection strategies. Jurnii UX tracks these performance metrics daily, showing your executive team the exact cost of technical debt.
Jurnii Studio's Measurement and Analytics Infrastructure
Identifying the financial impact of user experience is only the first step. To sustain these gains, you must build the data infrastructure needed to monitor CX ROI continuously. Jurnii Studio's Measurement & Analytics service helps operators build these commercial dashboards. We integrate Jurnii's experience intelligence data directly into your internal business intelligence (BI) systems and data warehouses. We connect usability scores to your CRM records, allowing you to segment player LTV by the usability quality of their interactions. This infrastructure allows you to track:
- FTD Uplift: The direct increase in new depositors following interface updates.
- Wager Frequency: How improvements to betslip usability influence total bets placed per session.
- Retention Elasticity: The correlation between fast, error-free withdrawal flows and long-term player retention.
- Attribution Error Reduction: Isolating competitor promotional noise from your internal conversion variance. This always-on measurement ensures that your product decisions remain objective and defensible to the board. The CMO can prove marketing efficiency, the CPO can justify engineering priorities, and the CCO can optimize promotional spend, all guided by a single, financially aligned data source.
Grounding the Product Roadmap in Financial Reality
Relying on aesthetic preferences or competitor snapshots to prioritize your product backlog is a significant commercial risk. It leads to wasted engineering capacity and flat line performance. To win in a mature, regulated market, you must treat user experience as critical financial infrastructure. Ground your design decisions in revenue, quantify the NGR recovery potential of every optimization task, and build the analytics dashboards needed to prove your ROI. Optimize your interface, protect your margins, and grow your NGR. Benchmark. Act. Outperform.